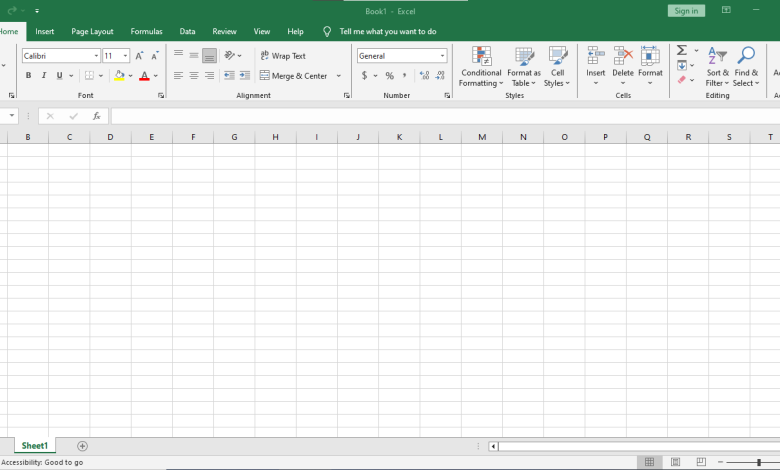
Advance Excel

Advanced Excel for Data Analysis and Reporting
Course Description:
This course is aimed at professionals who want to master advanced Excel features and techniques to analyze, manage, and visualize data efficiently. It will cover advanced formulas, data analysis tools, automation through VBA (Visual Basic for Applications), and methods for building dynamic, interactive reports and dashboards. By the end of this course, participants will be able to tackle complex data analysis tasks, automate repetitive processes, and create sophisticated reports for business decision-making.
Course Objectives:
By the end of this course, students will be able to:
- Master advanced Excel functions, formulas, and tools for in-depth data analysis.
- Create dynamic models and forecasts using Excel’s advanced capabilities.
- Utilize Excel’s data visualization tools to create interactive dashboards.
- Automate tasks and processes with VBA (Visual Basic for Applications).
- Manage large datasets efficiently using Power Query and Power Pivot.
- Perform sophisticated statistical analysis and trend forecasting.
- Build robust, error-free spreadsheets for financial modeling, project tracking, and business reports.
Course Modules:
Module 1: Advanced Functions and Formulas
- Array Formulas and Advanced Functions: INDEX, MATCH, OFFSET, and INDIRECT functions
- Logical and Lookup Functions: IFERROR, AND, OR, SUMIF/SUMIFS, VLOOKUP, HLOOKUP, and XLOOKUP
- Text Functions: CONCATENATE, TEXTJOIN, LEFT, RIGHT, MID, TEXT
- Date and Time Functions: NETWORKDAYS, WEEKDAY, DATEVALUE, TIMEVALUE, and more
Module 2: Data Analysis and Modeling Techniques
- PivotTables and PivotCharts: Advanced grouping, filtering, and summarizing data
- Data Validation: Restricting user inputs and creating custom validation rules
- What-If Analysis: Goal Seek, Scenario Manager, Data Tables
- Solver Add-in for Optimization: Solving complex equations and optimization problems
- Statistical Functions: Descriptive statistics, regression analysis, correlation, and analysis of variance (ANOVA)
Module 3: Power Tools in Excel
- Power Query: Importing and transforming data from different sources (Excel, SQL, Web, etc.)
- Power Pivot: Creating data models and managing large datasets with relationships and measures
- Data Modeling: Building complex relationships and DAX (Data Analysis Expressions)
- Power View & Power Map: Creating interactive data visualizations and geospatial charts
Module 4: Excel Dashboard Design and Visualization
- Creating Interactive Dashboards: Slicers, Timelines, and Dynamic Charts
- Advanced Charting Techniques: Combination charts, waterfall charts, Gantt charts
- Conditional Formatting: Highlighting key trends, creating heat maps, and visual cues
- Data Visualization Best Practices: Effective storytelling through data, chart selection
Module 5: Excel Automation with VBA
- Introduction to VBA (Visual Basic for Applications): Basics of macros and VBA code
- Automating Repetitive Tasks: Writing and editing macros, debugging code
- User Forms: Creating custom dialog boxes and forms for data entry
- Advanced VBA Techniques: Custom functions, loops, and error handling
- Integrating VBA with Excel Functions and Tools
Assessment & Evaluation:
- Assignments: Weekly exercises focused on practical use of Excel tools and techniques (30%)
- Case Study Project: Real-life scenario where students create a comprehensive Excel solution using advanced features (30%)
- Midterm Exam: Theoretical and practical exam covering advanced functions and analysis tools (20%)
- Final Project: A complex Excel dashboard or automation project (20%)
Target Audience:
- Business analysts and data analysts
- Financial professionals and accountants
- Project managers and team leads
- Anyone looking to advance their Excel skills for better data analysis, reporting, and automation
- Professionals seeking to automate workflows and enhance productivity using Excel